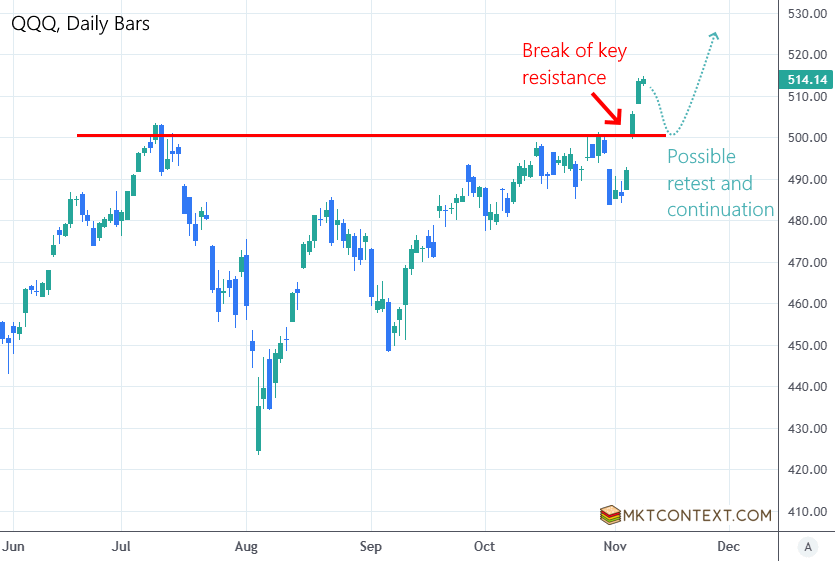
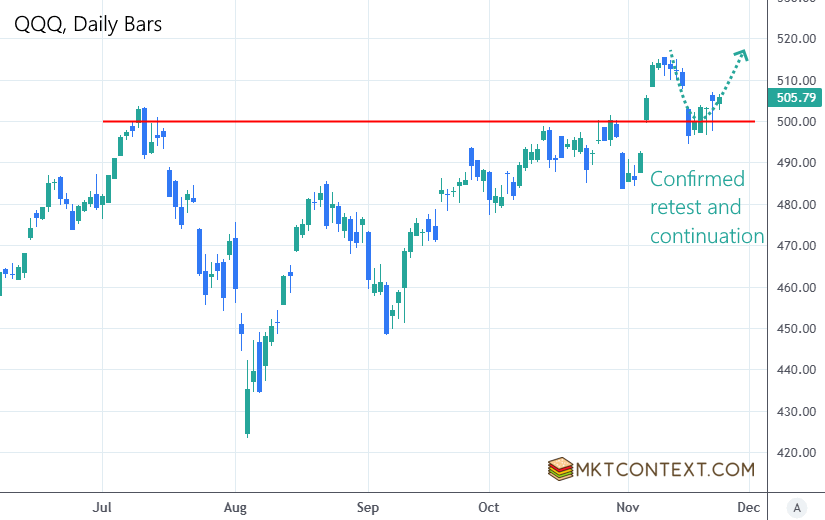
Below is the QQQ chart we published two weeks ago for paid members (dotted line was our prediction). At the time, we said “this dip should be bought!”. This prediction is playing out to a T as both SPX and QQQ rebound this week.
Here’s the same chart, today. Not only did we predict the dip was coming, we also timed the bounce using our proprietary technical indicators. Last Sunday we wrote, "we would bet on the market rebounding in the next week or so”.
Many of our premium subscribers, both short-term traders and long-term investors, were able to trade this bounce to profit thousands of dollars. Understanding the macro and technicals will help you time the market.
In today’s post:
Staging a recovery
Where the labor market strength is coming from
Easy money
Regulating Mega Cap tech stocks
Semiconductors downfall
a NEW sector trade
Defense stocks attacked
Staging a recovery
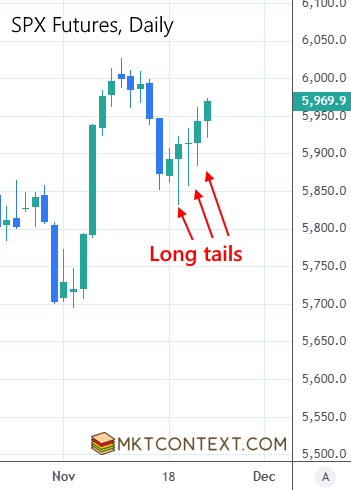
As highlighted in the above chart, the market is bouncing from the dip. This week we had several reports of Russia escalating the war against Ukraine, plus other negative econ news out of Europe. As a result, S&P500 futures sold off overnight but bounced sharply into US trading hours. This produced long tails on the daily candles of SPX futures:
Long tails are a sign of a market staging a recovery. It indicates buyers stepped in to aggressively bid up prices and reject the lows. It’s especially bullish when each consecutive day closes higher than the last (a.k.a. one-time-framing or OTF). Seeing this during the rebound phase is a positive indication that the rally will likely continue.
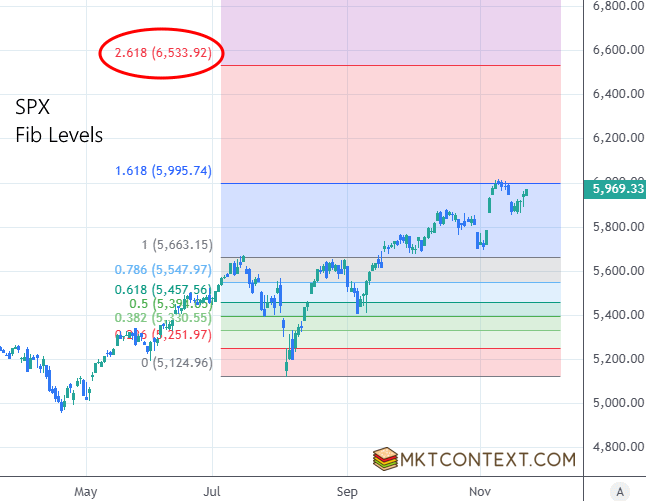
A short-term return to $6,000 is highly likely by next week. Looking very long term, our Fib levels suggest a target of $6,500 for the SPX is in the cards! This is the same technique we used to derive our initial $6000 price target back in October.
We're helping traders and investors improve their performance. Spread the word!
Where is labor market strength coming from?
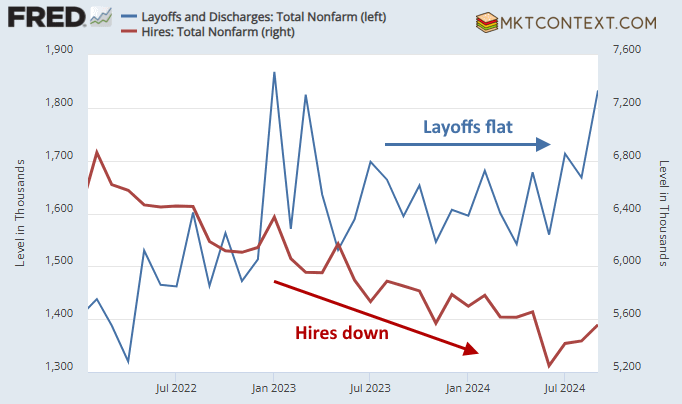
Amidst a quiet macro week, jobless claims were stable. We have been arguing that companies are reducing hiring and slowing growth, but not laying people off (chart below). This only happens when the economy is decelerating but not dying; consistent with estimates of 3% GDP growth. In order for recession to happen, layoffs need to spike which causes people to reduce spending, leading to lower demand and more layoffs — a death spiral.
Note that the spike in the most recent layoffs print for Sept was temporarily bumped up by hurricane activity and strikes. Nothing to be worried about.
Some investors argue the government is propping up the job numbers with hires that are not indicative of the real economy (education, healthcare, etc). Not entirely true. After the tremendous semi-permanent loss of workers during Covid, government sectors are still recovering their workforce. Those are real jobs with real spending power, and contribute to the ongoing tightness of labor supply:
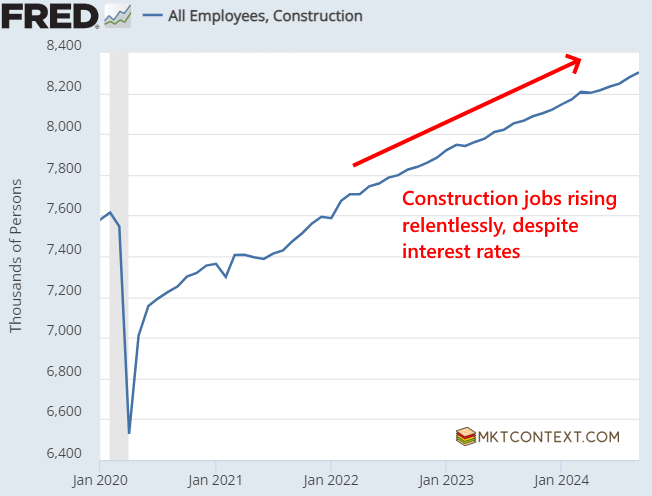
The construction industry is notoriously cyclical and sensitive to interest rates. Because of this, it usually leads the spill-over into recession. Yet commercial construction jobs have been growing relentlessly this cycle. This can be attributed to: 1) onshoring projects as companies reinforce supply chains, and 2) massive fiscal spending from the Inflation Reduction Act (IRA).
As long as construction is growing, those cyclical employees will have money to spend. The latest print is still positive month-over-month. Until and unless the construction bubble ends, there can’t be recession. We’ll keep monitoring this going forward.
Easy money…
The rest of this article is for paid subscribers. Upgrade now to continue reading the rest:
Easy money and the impact on real economy
Regulation of mega-cap tech giants
Semiconductors downfall
A new burgeoning sector?!
Defense stocks crater as expected
Claim your one week free trial below!
Keep reading with a 7-day free trial
Subscribe to MKTCONTEXT to keep reading this post and get 7 days of free access to the full post archives.


